By
David W. Johnson
Presented At 1994 National Petroleum Refiners Association Annual Meeting San Antonio, Texas March 20-22, 1994
Abstract
In the summer of 1991, an experimental program was conducted to determine the amount of equilibrium sulfuric acid that would pool, or fall to the ground, when the acid, both alone and as an emulsion with alkylation hydrocarbons, was released to the atmosphere. The acid/hydrocarbon emulsion was prepared in a highly agitated vessel and held at conditions that encompassed the normal range of alkylation unit operating conditions. The fluid was released to the atmosphere through square-edged circular orifices from 0.032 to 0.50 inches in diameter, circular tubes 0.25 and 0.5 inches in diameter, and a simulated flange gasket failure.
Thirty-six release runs were made, three runs using alkylation equilibrium acid (obtained from an operating commercial alkylation unit) and thirty-three runs using an acid/hydrocarbon emulsion. Usable data were obtained from thirty-one emulsion runs. The releases of equilibrium acid alone gave recoveries between 100.3 and 100.9 percent, indicating a small bias of recovery over release. Of the twenty-eight runs made by releasing an equilibrium acid/hydrocarbon emulsion, an average of 97.6 percent of the acid released was recovered (i.e., would have fallen to the ground). The capture percentages were grouped closely around the average, ranging from 92.5 to 100.4 with a standard deviation of 1.6.
Changes in release geometry, storage temperature, storage pressure, ratio of acid to hydrocarbon (for hydrocarbon/equilibrium acid emulsion releases), or the propane content of the hydrocarbon did not change the amount of acid recovered by more than the estimated experimental error of the measurements.
Small bubbles were observed to float above the capture equipment during all of the acid/hydrocarbon releases. These bubbles were suspected to be composed of a thin layer of equilibrium acid surrounding an inner core of hydrocarbon vapor.
Text
Introduction

Refinery alkylation units employ fluids that are both flammable and toxic. Although the release and ignition of flammable fluids is a concern for the refinery operator, the release of toxic materials is often the event that poses the greatest threat to the general public. For this reason, toxic releases are the events in which regulators have a keen interest. Both sulfuric acid and hydrofluoric (HF) acid are used as catalysts for the alkylation reaction. Each material is toxic and each presents somewhat comparable dangers if finely dispersed in the air.
A series of large-scale HF release tests was conducted at the Liquefied Gaseous Fuels Spill Test Facility (LGFSTF) in Nevada during the summer of 1986[1]. The releases were performed to determine how much of the released HF would fall to the ground. The superheated, pressurized HF formed a vapor and aerosol mixture upon its release. Very little liquid pooling was observed; almost all of the released material traveled downwind in the airstream. Although the results surprised some observers, earlier releases of superheated, pressurized LPG and ammonia [2, 3] resulted in similar experimental findings.
In 1990, a comparison of HF and sulfuric acid alkylation risks[4] estimated that a release of a sulfuric acid/alkylation hydrocarbon emulsion could result in 10 to 65 percent of the sulfuric acid becoming airborne. Based on operating experience, users of the sulfuric acid alkylation process felt that the estimate of airborne material was high. However, experimental data for a release stream consisting of two immiscible emulsified liquids, one superheated and one subcooled, were not available. The liquid release models available in 1991 were not capable of accurately predicting the available one-component data, let alone the more complicated hydrocarbon/sulfuric acid system. A group of interested companies operating under the Petroleum Environmental Research Forum (PERF) agreed to fund a test program. Exxon Research and Engineering Company acted as the test sponsor and coordinator. Other participating companies were Stratco, Mobil, Chevron, Texaco, Amoco, Unocal, and British Petroleum. The primary purpose of the program was to determine the percentage of equilibrium sulfuric acid that would fall to the ground when a hydrocarbon/sulfuric acid emulsion was released from storage. The design and procurement of test equipment were done during the spring of 1991, equipment construction occurred May through July, and the experimental program was performed between September and October of 1991.
Experimental Equipment
The experimental equipment used in the test program was designed to perform three functions:
- Simulate the operating environment found in a “typical” sulfuric alkylation unit.
- Release both acid and an acid/hydrocarbon emulsion from pressurized storage in a controlled manner and accurately measure the amount of acid and hydrocarbon released.
- Collect and accurately measure the amount of acid falling to the ground.
During the initial design stage, engineering choices were made regarding the size and duration of the tests. The design parameter ranges and design parameters used in the equipment design are summarized in Table 1. The process flow diagram for the equipment used in the tests is shown in Figure 1.
In order to accommodate the design parameters, a release vessel volume of 35 ft3 was selected. This volume allowed a 17 ft3 working volume with the tank 80 percent liquid full and a 1 ft freeboard above the level of the release line. The release line was chosen to be 2 inches in diameter, allowing low pressure drop without excessive residence time. A 1/4-inch orifice size was selected for the majority of the tests as this orifice size has been used in other release tests [5, 6] and has been shown to be large enough to avoid scale-up effects. Provision was made to allow larger and smaller orifice diameters.
Accurate measurement of the weight of released liquid required the use of high accuracy load cells to weigh the release tank. Commercial load cell units of 0.03 percent accuracy were specified for the support of the release tank, and flexible couplings were used on all piping and electrical connections in order to minimize the influence of external forces. Figures 2 and 3 show the final design of the release tank and support system.
Table 1
Design Parameters

The release tank mixer was required to:
- produce a stable acid/hydrocarbon emulsion with acid volumetric fractions between 1.0 and 0.1, and
- have variable speed operation.
Basic design information, such as release tank dimensions, liquid properties, and names of testing fluids, was supplied to several mixer manufacturers, and their quotes were evaluated by sponsor company mixing specialists. All companies responding to the request for quotation provided acceptable mixer designs.The mixer used in the testing was equipped with a 10 hp variable speed motor and 15-inch flat paddle turbine impeller. The turbine rpm was adjustable between 30 and 275 rpm and the rpm could be maintained to within 1 percent.
The release tank was maintained at constant temperature by circulating the emulsion stream through an external plate and frame heat exchanger that was cooled by a remote water/glycol refrigeration system. Heating requirements were provided by the normal heat input due to the circulation pump, the mixer, and vessel heat leaks. The external exchanger kept release vessel connections to a minimum, allowed vigorous mixing
Figure 1
Process Flow Diagram for Facility

Figure 2
Release Tank Diagram

Release Tank Support System

in the release tank (no obstructions), and minimized the weight of the release tank. The water/glycol heat transfer fluid was kept above 30°F to prevent the solidification of sulfuric acid. The acid and hydrocarbon charge tanks were sized so that a complete release vessel charge could be made, regardless of the acid-to-hydrocarbon ratio. The hydrocarbon storage tank was sized to make up and store enough hydrocarbon for the entire test series.
Accurate temperature measurements in the release tank were made using two resistance temperature detectors (RTDs). Each RTD was calibrated before use. Release tank pressure was measured using high accuracy strain gauge type pressure transducers. Each pressure transducer was calibrated against a pressure gauge of known accuracy (0.25 percent).
The acid recovery system was designed to cover the anticipated throw of the acid or emulsion from the release tank. Based on an orifice-to-capture pan vertical drop of 4 ft and a discharge pressure of 100 psig, the computed throw of liquid was less than 50 ft. From previous release testing, a capture width of 15 ft was deemed sufficient to contain the released material. The capture pans were designed to stand at a height of approximately 4 ft above grade so the weighing vessels could be easily moved under the pans. The final design of the capture system required a capture surface 50 ft in length, 15 ft in width, and with a minimum underpan clearance of 48 inches. Figure 4 shows the general detail of a capture pan.
Three release fittings were used during the tests. The majority of tests were conducted using a sharp-edged orifice. The orifice was constructed of 316 stainless steel and machined from a 2-inch 150 lb blind flange. Four orifice sizes were used in the tests, a 1/4-inch orifice, a 1/2-inch orifice, a 1/16-inch orifice, and an orifice consisting of five 1/32-inch holes. A flange leak was simulated by cutting a passageway in a 1/8-inch metal spacer held between two 2-inch 150 lb flanges. The flow area of this release fitting was approximately the same as a 1/4-inch orifice. Releases were also made using either 1/4- or 1/2-inch stainless tubing attached to a 2-inch blind flange that was drilled and tapped to hold either a 1/4-or 1/2-inch Parker tube fitting. The tubing length was set to give a length-to-diameter ratio of 28. Figures 5 and 6 are sketches of the flange and tube fittings.
A wind buffer system was installed around three sides of the release equipment. The purpose of the buffer was to reduce the velocity and turbulence in the wind field. By reducing these variables, the release stream would be less likely to be pushed outside the capture pan area; noise in the release tank and capture vessel weighing systems would also be significantly reduced by lowering both the wind speed and turbulence. The buffer system surrounded an area approximately 5 ft from the release pad on the south, east, and west sides. The north side, i.e., the direction of release, was left open. Polypropylene greenhouse shade cloth was placed over a wire support and provided the major wind resistance. During typical weather conditions, the wind buffer system would reduce both the absolute wind velocity and the wind velocity variation by a factor of 3 to 5.
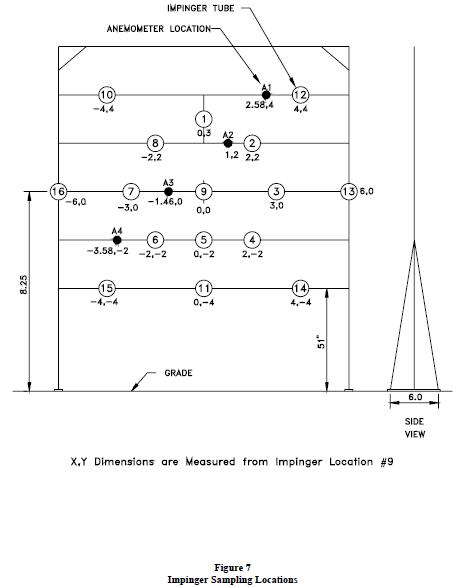
To provide an estimate of the amount of airborne liquid remaining in the vapor stream, an airborne acid sampling grid was placed 7 ft from the downwind end of the capture pans. The sample grid consisted of sixteen sampling and four wind speed monitoring points. The sampling locations were positioned as shown in Figure 7. Each sampling point consisted of an impingement sampler with a fitted nozzle and a remotely located constant flow sample pump.
The data acquisition system consisted of an IBM PC-type computer using an Intel 486 processor, a high speed analog-to-digital convertor, and several signal multiplexers. Current loop signals were converted to 1 to 5 volt signals at the multiplexer using precision 250 ohm resistors. The DAS interface board and multiplexer boards had a maximum sampling rate of 50,000 scans per second, with a resolution of 12 bits (1 part in 4096). The DAS software used to log the data could simultaneously scan and display 570 channels of data per second. Nineteen channels of data were logged during the test program at a rate of 95 channels per second.
Figure 4
Capture Pan

Figure 5
Flange Fitting

Figure 6
Tube Fitting

Figure 7
Impinger Sampling Locations
Safety showers and eye wash stations were placed at convenient locations near the testing area. Water from the process water tank was continuously circulated through the safety shower system so that hot spots would not occur.
Figure 8, a plot plan of the test site, locates the position of major pieces of equipment, the wind buffer system, and the safety water system.
Test Plan
The preliminary test plan, as outlined in the original project proposal, projected a test program consisting of 50 releases covering a temperature range of 40 to 70°F, pressures from saturation to 100 psia, orifice diameters of 1/16 and 1/4-inch, and acid-to-hydrocarbon volumetric ratios from 100/0 to 10/90. Little was known about the conditions where acid airborne material might be formed, so the preliminary test matrix was designed to cover a wide range of operating conditions.
The initial acid/hydrocarbon releases were at conditions conducive to the formation of airborne material, i.e., maximum temperatures and moderate acid-to-hydrocarbon ratios. The results from the first acid/hydrocarbon emulsion release yielding valid data (TR-05) indicated that acid capture near 98 percent was likely. Two additional releases were made at these conditions, TR-06 and TR-07, giving confirmation to the high acid captures. Because captures were high under the conditions originally felt favorable to airborne material formation, the test plan was revised to:
- include test conditions even more favorable to the production of airborne material, such as releases in tubes with high length-to-diameter ratios and releases using hydrocarbon with more volatile components;
- gain information as to the disposition of the acid that was not captured; and
- run multiple tests at a set of “base case” conditions to provide a standard of comparison and an estimate of experimental uncertainty.
The base case conditions selected were 70°F, 42 psig storage pressure, 50/50 acid/hydrocarbon charge volume, and 1/4-inch orifice release geometry. As the testing progressed, additional equipment and mini-experiments were added in an effort to understand the method of acid loss. The mini-experiments performed included the placement of an array of glass plates in a 100 by 100 ft grid downwind of the capture pans, the use of white paper impingement surfaces to catch acid drops, and nighttime tests to allow the use of high intensity light beams and high speed flash photography. Because the amount of acid lost during a release was approximately the same as the estimated experimental uncertainty, the amount of information that could be gained from any of these experiments was limited. During the course of the test program, each of the mini-experiments yielded a small measure of insight into the disposition of the uncaptured acid.
The information gained during prior releases was used to guide the planning of the remaining releases. As a result, the experimental program did not follow a pre-set plan; rather, it evolved in response to prior results and input from the sponsoring companies.
Test Procedure
Alkylation equilibrium acid and hydrocarbon were charged from their respective storage tanks using nitrogen pressure to displace each liquid. Acid was transferred first in order to produce an acid continuous phase. When the required volume of acid was transferred, the release tank agitator was started and adjusted to give an agitator speed of about 150 rpm. Hydrocarbon was then transferred to the release tank. After the required hydrocarbon volume was transferred, the refrigeration loop was placed in operation. Several attempts were made to produce an emulsion with hydrocarbon as the continuous phase by introducing the hydrocarbon first, followed by the acid. The attempts were unsuccessful and hydrocarbon continuous emulsion releases were not made.
Figure 8
Plot Plan of Area

While the temperature control was being established, the acid recovery system was readied for the first run. Each of the five capture pans was inspected to verify the drain valves were closed and no residual acid or water remained in the pan. The individual weighing vessels were inspected and the recovered acid load cells checked to ensure proper operation. During this time, emulsion samples were trapped in the circulation sight glass and allowed to separate. The volumetric ratio of each phase could be determined by the liquid interface position. Several samples were taken before each run to ensure that the emulsion in the release tank contents had reached a steady state condition.
About one hour before the start of a test, the video cameras were placed in position and titles recorded. One-half hour before the test, the impinger water levels were checked and distilled water added, fresh paper placed in the impinger support, and the glass plates (if used) positioned in the field. At approximately the same time, the impinger pumps were checked for proper operation.
Just before the start of each test, the pressure in the release tank was brought up to the desired level and the pressure control system placed in automatic operation. When the release tank pressure reached the set point, the pressure controller was placed in automatic operation, with the release tank vent valve slightly open. This allowed the pressure controller to maintain pressure in an active mode, minimizing any pressure disturbance when the release valve was opened. Simultaneously with establishing pressure control, a final emulsion sample was caught in the sight glass. This sample was used to determine the volume fraction of acid and hydrocarbon in the released liquid.
About one minute before a test, the video recorders were started and confirmed to be in operation; 30 seconds before the start, data acquisition commenced. After the release was completed, a period of 30 minutes was allowed before personnel entered the test area. This time period allowed the captured acid/hydrocarbon to separate, hydrocarbon to evaporate, and flammable and/or toxic vapor to be swept from the immediate area. At the end of the 30-minute period, personnel would enter the test area and begin draining each capture pan into its assigned weighing vessel. As each capture pan was drained of concentrated acid, the weighing vessel was moved to one of the three load cell weigh stations and weighed. After weighing, an acid sample was taken from each vessel. While the weighing vessels were being weighed, 30 gal plastic containers were placed under each capture pan, and the capture pans were water washed. The dilute acid wash solution was weighed and samples were taken for later analysis. The recovered concentrated acid was placed in high density polyethylene drums and the wash acid emptied into a 2,000 gal holding tank for later neutralization.
While the acid weighing was being completed, the release tank was prepared for the next run, i.e., changing the release fitting, the release tank temperature, or the acid-to-hydrocarbon ratio in the release tank. When possible, runs were scheduled so that the required between-run changes could be made as rapidly as possible.
Analytical Procedure
During the course of the experimental program, considerable time and effort were spent on sample analysis. During each release test, between 24 and 56 acid samples were collected for analysis. Periodic samples were also collected from the equilibrium acid storage tanks. These samples were analyzed as rapidly as possible in order to provide up-to-date test results to the participating sponsors. Samples of the hydrocarbon stock were also analyzed from time to time during the course of the experimental program.
Concentrated acid samples were analyzed by titrating with a standard sodium hydroxide solution. All titrations were conducted to an end point shown by the color change of phenolphthalein in the solution. End points were easily visible with hydroxide volume additions of less than 0.05 ml. The acid samples were prepared by weight, and a minimum of three analyses of each acid sample were made. The deviation between individual analysis and the average was seldom larger than 0.5 percent. The error in the concentrated acid analysis is estimated to be less than 0.5 percent.
The sodium hydroxide solution used to titrate the concentrated acid samples was prepared using chemically pure sodium hydroxide and distilled water. The resulting solution was standardized using potassium acid phthalate primary standard (Fisher P243-100). The phthalate solution was titrated using the prepared sodium hydroxide with phenolphthalein indicator. A minimum of three samples of hydroxide were analyzed during each standardization. Typically, the variation of any titration from the average was less than 0.15 percent.
Wash acid samples were analyzed using the same equipment as concentrated acid samples. Their acid strength was typically 1/40th that of the concentrated acid samples. For this reason, larger wash acid samples were weighed and titrated. The sodium hydroxide titrant solution used for this analysis was 1/20th as strong as the hydroxide used for concentrated acid analysis, but was standardized in a similar manner. The deviation of the wash acid titration about the average seldom exceeded 0.75 percent. Typical wash acid samples contained visible amounts of rust rinsed from the capture pans. Occasionally, the turbidity of the sample would make end point detection difficult. If this was the case, a pH meter was used as an alternate end point indicator (end point used was a pH of 9.0). Blanks of wash water were periodically titrated to determine any residual acid or base in the water. The blanks showed that the wash water had negligible effect on the wash acid calculations. The estimated error in the wash acid analysis was 1.5 percent. This error was acceptable because the wash acid contained less than 5 percent of the total acid captured.
The hydrocarbon used in the experimental program was prepared by mixing pure propane, pure isobutane, and pure normal butane with debutanized alkylate from a sulfuric acid alkylation unit. It was expected that the hydrocarbon concentration would change over the course of the program due to venting of hydrocarbon vapors, etc. In order to accurately determine the hydrocarbon physical properties, hydrocarbon liquid samples were collected and analyzed using gas chromatography. The estimated precision of the hydrocarbon analysis was 5 percent.
The volume fraction of acid and hydrocarbon composing each emulsion was determined by trapping a sample of the emulsion in a tubular sight glass, allowing the emulsion to separate, and reading the level of the acid/hydrocarbon interface. The sight glass was volumetrically calibrated in place by pipetting known volumes of distilled water into the top of the sight glass and measuring the change in liquid level. The sight glass was mounted on the outlet of the release tank, just ahead of the circulation pump suction. Several measurements of a continuously circulating emulsion showed that the repeatability of the measurement was 0.5 percent.
Quantative Results
Table 2 presents a summary of all runs made during the experimental program. Based on an error analysis that took into account the laboratory uncertainty as well as the uncertainties in the measured process variables, the expected range of error in the results is ±1.5 points.
The results will be compared to a “base” case release. Runs TR-05, 06, 07, 18, 22, and 32 comprised the “base” case set of data. These runs were made at a storage temperature of 70°F, a storage pressure of 42 psig, and a 1/4-inch diameter orifice. The base case releases were at conditions considered favorable to airborne particle formation. The average acid recovery for these runs was 98.1 percent with a standard deviation of 1.1 percent. The recovery for these releases ranged from 99.2 to 96.5 percent.
Table 2
Summary of Experimental Program Runs
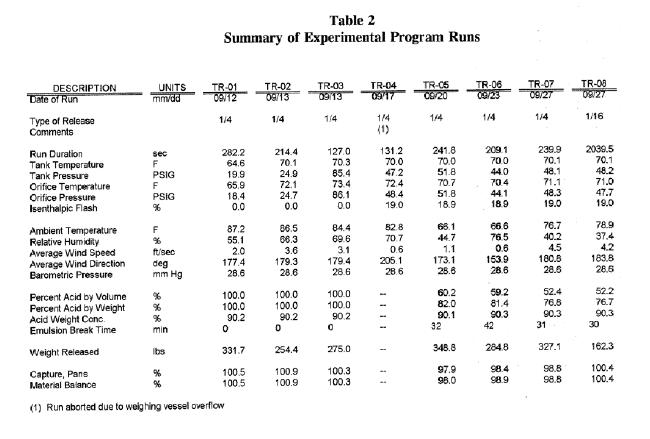
Table 2
Summary of Experimental Program Run continued

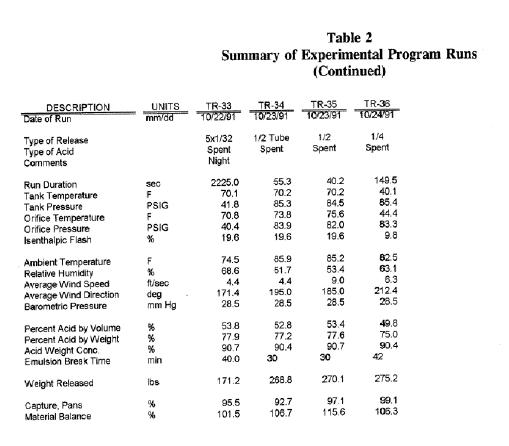
Table 2
Summary of Experimental Program Run continued

Table 2
Summary of Experimental Program Run continued
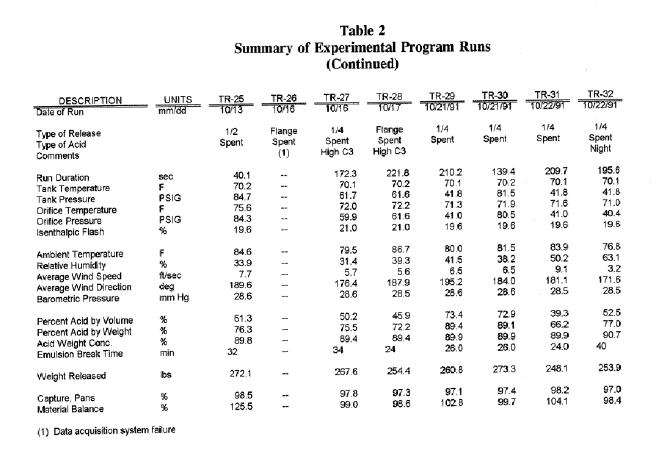
Table 2
Summary of Experimental Program Run continued
The first three releases (TR-01, 02, and 03) were made using equilibrium acid alone. These runs were made:
- to test the operation of the equipment and analytical procedures,
- to provide a set of releases that should give close to 100 percent recovery, and
- to determine if a release of equilibrium acid would form airborne particles. These runs gave an average acid recovery of 100.6 percent with a standard deviation of 0.3. The runs indicate a slight bias of recovery over release.
The effect of release pressure was studied using runs TR-17, 25, 34, and 35. These runs were made at a release pressure of 85 psig and consisted of both orifice and tube releases. The average recovery for these runs was 97.4 percent (excluding TR-34) with a standard deviation of 1.0, indicating little effect of storage pressure over the range of storage pressures. All high pressure acid recoveries fell within the experimental range of the base case runs, with the exception of run TR-34. This run, a 1/2-inch tube release, resulted in acid falling on either side and just beyond the recovery pans. Because of the acid overspray observed during this release, the measured recovery may be lower than what actually occurred.
Two storage temperatures were used in the testing, 70 (base case runs) and 40°F. Runs TR-11, 16, and 36 were made at 40°F. The average recovery for the 40°F runs was 99.1 percent with a standard deviation of 0.6. The 40°F recovery was slightly higher than the base case runs, but within the range of the “base” case results (99.6 to 96.6 percent).
Releases were made with several acid-to-hydrocarbon ratios in the emulsion. Runs TR-14, 29, and 31, made with emulsions having acid volume fractions of 0.329, 0.734, and 0.393, had an average recovery of 97.4 percent with a standard deviation of 0.8. There appears to be no correlation between acid volume fraction and recovery for the acid/hydrocarbon emulsion releases over the range of acid volume fractions studied.
The effect of release geometry was investigated in runs TR-10, 15, 23, and 24. Runs TR-10 and 23 were made with a geometry simulating a flange gasket partial failure, and runs TR-15 and 24 were releases made through circular tubes. The tubes had a length-to-diameter ratio of 28. The average recovery for these runs was 97.4 percent with a standard deviation of 1.7. The recovery ranged from 99.2 to 95.1 percent.
Runs TR-08, 20, 21, and 33 illustrate the effect of releasing through orifice diameters from 1/32 to 1/2-inch. These releases had an average recovery 98.1 percent with a standard deviation of 1.8. The lowest recovery was 95.4 percent for a 1/32-inch diameter orifice, although an identical release (TR-20) gave a recovery of 98.3 percent (average recovery for both runs was 96.9 percent). The 1/16, 1/4, and 1/2-inch orifice runs had recoveries ranging from 100.4 to 98.2.
Figure 9 plots all usable acid recovery data points (including the acid only runs), as well as lines defining one and two experimental error bands. Figure 10 replots the data of Figure 9 on a range of 0 to 110 percent recovery. Figure 10 shows the small deviation of the test data and the consistently high acid capture measured during the testing.
Qualitative Results
During the testing, some semi-qualitative measurements were made in an effort to determine the disposition of the unrecovered acid. The significance of these observations is open to individual interpretation.
A cross section of the air stream at the rear of the capture pans was sampled using glass impingers. The impingers drew air through a fritted glass bubbler immersed in distilled water. The acidity of the water solution before and after each run, combined with the rate of air flow through the impinger, gave a semi-quantitative measure of the amount of airborne acid. Runs TR-20, 24, 25, 34, 35, and 36 gave airborne readings inconsistent with the measured recovery. A material balance, acid recovered plus acid in the air, for all
Figure 9
Summary of Acid Recovery Results

Figure 10
Summary of Acid Recovery Results

other runs gave an overall material balance of 100.6 percent with a standard deviation of 1.8. Data obtained from the impinger array were downgraded in importance for several reasons:
- the collection of a single large acid drop could change the results by as much as a factor of 10,
- isokinetic sampling of the airstream was not possible,
- variations in wind direction could result in airborne material missing some of the impinger array, and
- impinger joint design made elimination of acid contamination during water collection difficult.
During several runs, flat glass squares were placed on 25 foot centers over a 100 by 100 foot area downwind of the capture pans. At the end of a run, the plates were observed and sometimes photographed. The photographs were used to determine the quantity and size of drops falling to the ground. The glass plates were carefully analyzed after run TR-23. For the plates on the release centerline, the mass mean particle diameter of the settled droplets ranged from 32 to 65 microns. The total mass deposited on the plates represented only a small portion of the material not collected in the capture pans.
Vertical white paper squares were placed at four locations on the impinger sample framework during most runs, and horizontal squares were placed on the back row of the glass plate array during selected runs (TR-31, 32, 33, 34, and 36). After each run, the paper was collected and assigned a value for the amount of acid found on the paper. The values assigned ranged from “clear” meaning no observable acid to “very heavy” indicating almost complete coverage of the paper with acid. In general, higher pressure releases resulted in heavier acid spotting. Very few acid spots were found on the paper located at the rear of the glass plate array (approximately 175 ft from the release point). Drop size on this paper was considerably smaller than observed on the impinger paper samples.
Five acid/hydrocarbon emulsion releases were made at night (TR-11, 18, 19, 32, 33). These runs were made so that flash photography (TR-32, 33) and high intensity light beams (TR-11, 18, 19) could be used to determine the amount and content of any airborne material in the immediate area of the release. The flash photography showed areas downwind and above the release point that contained airborne material. These particles were also observed during the daytime runs, although the extent of their travel could not be easily determined. The particle density appears higher in the photograph of the 1/32-inch release (TR-33) than in the 1/4-inch release. Some of this airborne material is suspected to consist of acid film/hydrocarbon core bubbles. These “acid bubbles” may have been formed as the hydrocarbon in the emulsion flashed at the surface of the release jet. Some bubbles may have been formed as the hydrocarbon in the captured emulsion vaporized and formed a frothy acid/hydrocarbon vapor mixture. The acid/vapor froth lasted for several minutes after each release.
Discussion of Results
The range of temperature, pressure, and acid-to-hydrocarbon ratio studied in these tests encompassed the operating range found in sulfuric acid alkylation units. Within these conditions, the average recovery of released acid was 97.6 percent. The range of acid recovery was 92.5 to 100.4 percent. The variation in recovery caused by changes in temperature, pressure, acid-to-hydrocarbon ratio, orifice size, or release geometry was small and generally within the experimental error of the measurements. Run TR-34, the release with the lowest measured acid recovery, had considerable acid loss due to overspray. The acid recovery results of this release should be considered suspect for that reason.
Small bubbles thought to be composed of a thin layer of acid covering a core of hydrocarbon vapor were observed during many of the releases. These bubbles floated freely in the ambient air and, upon their collapse, could form a small liquid particle of acid. The existence of the acid bubbles is clearly shown in the flash photographs taken during the night runs TR-32 and 33. The 1/32-inch release resulted in an airborne cloud of higher particle density than the release using a 1/4-inch orifice. This is most likely due to the increased surface area-to-volume ratio present in the smaller diameter release.
The disposition of the unrecovered acid was difficult to measure. Possible explanations for the acid loss were:
- splashing of acid drops outside of the capture area,
- formation of acid/hydrocarbon bubbles, and/or
- formation of liquid airborne acid particles.
References
- Blewitt, D. N., J. F. Yohn, R. P. Koopman, and T. C. Brown, “Conduct of Anhydrous Hydrofluoric Acid Spill Experiments.” International Conference on Vapor Cloud Modeling, Cambridge, Massachusetts, November 2-4, 1987.↩
- Welker, J. R., and W. D. Cavin, “Vaporization, Dispersion, and Radiant Fluxes from LPG Spills.” Technical Report, U.S. Department of Energy, Contract DE-AC05-78EV-06020, May, 1982.↩
- Koopman, R. P., T. G. McRae, H. C. Goldwire, Jr., D. L. Ermak, and E. J. Kansa, “Results of Recent Large-Scale NH3 and N2O4 Dispersion Experiments.” Proceedings of the Third Symposium on Heavy Gas and Risk Assessment, November 12-13, 1984: pp. 137-156.↩
- Technica, Inc., “Quantitative Risk Assessments of Generic Hydrofluoric Acid and Sulfuric Acid Alkylation Units for Phillips Petroleum Company.” Management Summary, May, 1990.↩
- Johnson, D. W., “Release Characteristics of Superheated Water and CFC-11 Liquids. An Experimental Program.” Report to the Center for Chemical Process Safety, May, 1990.↩
- Johnson, D. W., “Release Behavior of Superheated Chlorine, Methylamine, and Cyclohexane.” Draft report to the Center for Chemical Process Safety, May, 1991.↩
Disclaimer
Care should be used in interpreting the results of this project (PERF 91-09). These results have been obtained using an experimental setup and may not be entirely applicable to all possible conditions that may be encountered in an industrial facility.
The information in this paper should be interpreted carefully, and each reader is responsible for drawing their own conclusions regarding the results contained within the paper.
Neither the sponsors for this work nor their contractors accept any legal liability or responsibility whatsoever for the consequences of its use or misuse.