By
John B. Cornwell and Mark M. Meyer
Presented AtII Risk Control Seminar Petróleos de Venezuela Puerto La Cruz, Venezuela October 13, 1997
Abstract
Much of the early work in the area of quantitative risk analysis and risk acceptance was instigated by the introduction of nuclear power. As electric utilities were proposing to build nuclear plants, the public began asking “Are they safe?” In response to this question, the industry had to answer several fundamental questions.
- What can go wrong?
- How often can it go wrong?
- Do the benefits of nuclear power outweigh the risks? Or, “How safe is safe enough?”
During the 1960s, when these questions were being asked, there were no established methods to determine the answers.
Text

Starr [1969] described an approach to answer the question “How safe is safe enough?” in a paper published in 1969. Starr proposed comparing the risk associated with an industrial activity to risks posed by other activities that individuals are exposed to on both an everyday and intermittent basis. Starr divided the risks into two categories: voluntary and involuntary.
- Voluntary risk is associated with activities in which a person participates by choice. Examples of voluntary activities include driving a car, flying in an airplane, rock climbing, and scuba diving. Generally, the individual uses his own value system and experience to determine if the risk of a voluntary activity is acceptable to him.
- Involuntary risks are associated with activities, conditions, or events to which a person might be exposed without his consent. Examples of involuntary risks include the risk of premature death from illness, natural disasters (earthquakes, floods, etc.), or the production and transportation of hazardous materials. For certain industrial activities, the “allowable” or “acceptable” levels of involuntary risk might be set by some government agency, rather than by each individual.
Using this approach, Starr developed a method to compare voluntary and involuntary risks. The risks were measured by computing the fatalities per person per hour of exposure and the average annual benefit per person involved. A summary plot of Starr’s risk comparison is presented in Figure 1. A review of Figure1
allows the following conclusion to be made; the public will accept voluntary risk levels that are approximately 1,000 times higher than involuntary risks. This conclusion was an important cornerstone in the development of various risk criteria in later years.
Figure 1
Risk Acceptability Criteria

APPLYING QUANTITATIVE RISK ANALYSIS (QRA) TO PETROCHEMICAL FACILITIES
During the past two decades, many regulatory agencies have required that quantitative risk analyses be performed as part of the overall process of permitting and building new petrochemical facilities, as well as modifying existing ones. The question remains, “How safe is safe enough?” Efforts to answer this question have resulted in various methods for presenting and comparing risks, several of which are described below.
Professionals in risk analysis realize there is no single measure that completely describes the risk a project poses to the public. Measures that have been used by risk analysts include hazard footprints, individual risk contours, and f/N curves.
Hazard Footprints and Vulnerability Zones
When conducting a QRA, it is necessary to determine the probability of occurrence (How often can it happen?) and the consequences (What is the effect if it does happen?) of each possible combination of conditions (i.e., hole size, release orientation, release outcome, wind speed, atmospheric stability, wind direction, etc.) for each potential release that is included in the study. For each potential release, each unique combination of these factors results in a “unique accident.”
A hazard footprint can be defined as the area over which a given unique accident is capable of producing some level of undesirable consequences (e.g., 1% mortality). A vulnerability zone is defined as the area within the circle created by rotating a hazard footprint around its point of origin. Any point within that circle could, under some set of circumstances, be exposed to a hazard level that equals or exceeds the endpoint used to define the hazard footprint. However, except for accidents that produce circular hazard zones (e.g., BLEVEs and confined explosions), only a portion of the area within the vulnerability zone can be affected by a unique accident. This is illustrated in Figure 2 by a generic example of a toxic vapor cloud hazard footprint (cross-hatched area) and its vulnerability zone.
Figure 2
Example of Hazard Footprint, Vulnerability Zone, and Hazard Corridor

Except for accidents that produce circular hazard footprints, the whole area within a vulnerability zone cannot be simultaneously affected by the effects of a unique accident. In addition, many “smaller” accidents might be capable of producing hazard footprints that would affect parts of the vulnerability zone associated with a “large” accident.
Vulnerability zones can be used to define the size and shape of the area around a facility within which there is a finite probability of exposure to a fatal hazard. Along a pipeline, this would be referred to as a hazard corridor. Persons located outside this area or corridor would not be at risk from accidents involving releases of hazardous materials from the facility or pipeline.
Individual Risk
The results of all possible unique accidents can be combined to produce a measure of the overall risk presented by the subject of the study. The measure of risk must be in a form that is easy to interpret and can be compared to risk criteria and/or risks associated with ordinary human activities.
Figure 3
Example of Individual Risk Contours

One presentation method that meets these criteria is the use of risk contours. An example of risk contours is presented in Figure 3. If early fatality is the measure of risk, then each risk contour is the locus of points where there exists a specific probability of being exposed to a fatal hazard, over a one-year period. The level of risk illustrated by a particular risk contour is the risk of lethal exposure to any acute hazards associated
with many possible releases. Because the risk contours are based on annual data, the risk level for a given contour is the risk to an individual who remains at a specific location for 24 hours a day, 365 days per year.
Risk contours define the summation of all hazard zones for all accident scenarios, combined with their respective probabilities. The set of risk contours in Figure 3 represents the variation of probability of fatal exposure (from a release within the facility) with location around the facility. It is important to note that the individual risk contours are independent of the local population density and distribution. Thus, whether there are 2, 20, or 200 persons at a specific location (for the entire year) outside the facility, the risk of exposure to a fatal hazard would be the same for each of the persons at that location.
Societal Risk
A second technique used to describe the overall risk posed by a hazardous materials facility is an accounting of the number of persons potentially affected by each unique accident. In this technique, the consequences (expressed as number of persons potentially exposed to a fatal hazard) and probability of occurrence of each unique accident are plotted as points on an x,y plot, as illustrated in Figure 4(a). As can be seen from this figure, the frequency or probability of occurrence of a unique accident may be extremely small.
The data can be consolidated into a more manageable form by grouping the number of fatalities into defined bands. For example, if the frequencies of all unique accidents that result in one to three fatalities are summed, a histogram is produced that represents the frequency at which one to three fatalities are expected to occur. By making similar groupings for other fatality ranges (3 to 10, 10 to 30, 30 to 100, etc.), the individual points in Figure 4(a) can be converted into the histogram shown in Figure 4(b).
Figure 4
Construction of an f/N Curve

If the frequency associated with each fatality range is modified by adding to it the frequency of each fatality range with more fatalities (e.g., adding the frequencies of 3 to 10, 10 to 30, 30 to 100, and 100 to 300 fatality ranges to the frequency for 1 to 3 fatalities), Figure 4(b) is converted to Figure 4(c). The result, Figure 4(c), is an f/N curve which is a measure of cumulative frequency versus consequences. By definition, any point on the f/N curve represents the expected frequency at which N or more persons will be exposed to a fatal hazard.
When calculating the consequences (expected number of fatalities) of any unique accident, the answer will depend on the local population density and distribution. Therefore, unlike individual risk contours, an f/N curve will change if the local population density or distribution changes.
Individual Risk Acceptability Criteria
There have been a few attempts to define acceptability criteria for public risk. Several international standards are described below.
Western Australia
The Environmental Protection Agency of Western Australia uses the following definitions of acceptable and unacceptable limits of individual risk for new industrial installations.
- Individual risk levels lower than 1.0 x 10⁻⁶ per year are defined as acceptable.
- Individual risk levels greater than 1.0 x 10⁻⁵ per year are defined as unacceptable.
Hong Kong
Individual risk guidelines have been developed by the government of Hong Kong for potentially hazardous installations. The guidelines are to be applied to new facilities and expansion of existing facilities. The purpose of the guidelines was to limit the expansion of housing developments near potentially hazardous installations.
In general, development of new housing near an existing facility, or expansion of a facility near existing housing, would be restricted if the individual risk of fatality contour of 1.0 x 10⁻⁵ per year encroaches onto the housing development. Thus, the Hong Kong criteria can be defined as:
- Individual risk levels lower than 1.0 x 10⁻⁵ per year are defined as acceptable.
- Individual risk levels greater than 1.0 x 10⁻⁵ per year are defined as unacceptable.
United Kingdom
The Health and Safety Executive (HSE) is the regulatory authority for hazard identification and risk assessment studies in the United Kingdom. In 1989, the HSE published a document entitled Risk Criteria for Land Use Planning in the Vicinity of Major Industrial Hazards. Individual risk criteria proposed by the HSE are:
- Individual risk levels lower than 1.0 x 10⁻⁶ per year are defined as acceptable.
- Individual risk levels greater than 1.0 x 10⁻⁵ per year are unacceptable for small developments.
- Individual risk levels greater than 1.0 x 10⁻⁶ per year are unacceptable for large developments.
Netherlands
The Directorate General for Environmental Protection in the Netherlands published a document entitled Premises for Risk Management, Dutch Environmental Policy Plan, 1989. This plan requires companies to quantify the risks associated with industrial activities and then determine their acceptability. For facility siting, the regulatory requirements are:
- Individual risk levels lower than 1.0 x 10⁻⁸ per year are defined as acceptable.
- Individual risk levels greater than 1.0 x 10⁻⁵ per year are unacceptable for existing facilities.
- Individual risk levels greater than 1.0 x 10⁻⁶ per year are unacceptable for new facilities.
Petróleos de Venezuela, S.A.
Petróleos de Venezuela, S.A. (PDVSA) published a document entitled Criterios para el Analisis Cuantitativo de Riesgos (Criteria for Quantitative Risk Analysis). The document requires companies to evaluate the individual risk levels posed by a project and compare them to the following criteria.
- Individual risk levels lower than 1.0 x 10⁻⁶ per year are defined as acceptable.
- Individual risk levels greater than 1.0 x 10⁻³ per year are defined as unacceptable.
Figure 5 presents a summary of the acceptability criteria.
Figure 5
Societal Risk Acceptability Criteria

Societal Risk Acceptability Criteria
At present, there are no widely accepted criteria for use in judging whether the risk represented by an f/N curve is or is not acceptable. Nevertheless, there have been a few attempts to define “acceptable” limits for f/N curves. The most widely referenced criteria are outlined below.
Groningen f/N Criteria
The f/N lines on Figure 6 were proposed by the Provincial Waterstaat, Groningen, Netherlands. The lines separate three categories of risk: “acceptable,” “needing further assessment,” and “unacceptable.”
Figure 6
Risk Criteria Provided by the Provincial Waterstaat Gronigen

United Kingdom Nuclear Industry Risk Target
The Health and Safety Executive [1987] has suggested frequency/consequence data from which an f/N curve can be made. The curve (acceptable/unacceptable line) would serve as a “target” for risks posed by nuclear power plants. The form of such an f/N curve derived from this data is presented in Figure 7. The curve is based upon the presumption that a large-scale accident would fatally affect people at great distances from the reactor; the x-axis (number of fatalities, N) extends out to the hundreds.
Proposed County of Santa Barbara System Safety Guidelines
Santa Barbara County, California, has proposed a set of risk guidelines for use in evaluating permitting of oil and gas development projects. The draft proposal [County of Santa Barbara, 1991] does not elaborate on the decision making process that was taken in developing these guidelines. The proposed guidelines for “off-site” risk, in the form of an f/N curve, are presented in Figure 8. The terms De Manifestis and De Minimis are simply other ways to say “unacceptable” and “acceptable.” De Manifestis is derived from Latin meaning “obvious risk,” in other words, a risk that should be obvious to all. De Minimis is derived from legal principals and means the level of risk is below a level of regulatory concern.
By these definitions, it would appear that the county is stating that if an f/N curve were below the De Minimis or “acceptable” line, there would be no need for extensive regulatory review. At the same time, if the f/N curve for a project were above the De Manifestis line, the risk to the public should be obvious and the project would be deemed “unacceptable.” The remaining area, the area between the two lines, is labeled the “grey region.”
Figure 7
United Kingdom Nuclear Industry Risk Target

Figure 8
Proposed Off Site guidelines for the County of Santa Barbara

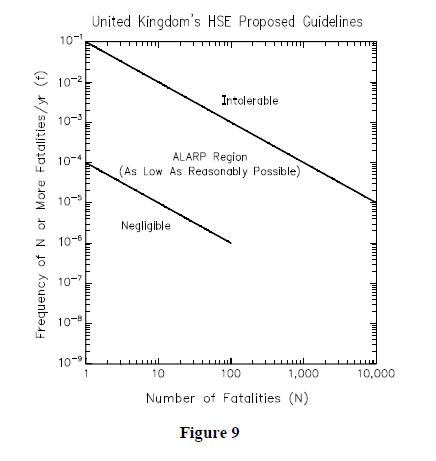
United Kingdom HSE Proposed Guidelines
The f/N lines on Figure 9 were proposed by the Health and Safety Executive (HSE), United Kingdom. The lines separate three categories of risk, “negligible,” “ALARP,” and “intolerable.” ALARP stands for “as low as reasonably possible.” This region of the curve indicates an area where further risk reduction measures should be considered (if reasonably practical).
Figure 9
United Kingdom’s HSE Proposed Guidelines
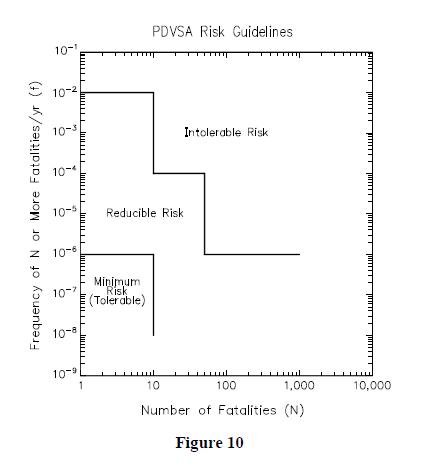
PDVSA’s Societal Risk Criteria
The f/N lines on Figure 10 are defined by PDVSA [1995]. The lines separate the “minimal risk (tolerable)” and “intolerable risk” with a region labeled “reducible risk.” The minimal risk area of the curve can be thought of as acceptable, while the intolerable risk area would be defined as unacceptable. The reducible region of the curve is similar to the HSE ALARP region. Reasonable risk reduction methods should be evaluated in a cost benefit analysis. If the benefit (risk reduction) justifies the cost, the risk reduction measures should be implemented.
As with all societal risk measures, the implementation of reasonable risk reduction measures may not move the project’s f/N curve totally into the “acceptable” region of the curve. At the end of the risk analysis, the governing body must decide if the predicted risk is “low enough.”
Conclusions
A review of the individual risk levels proposed and used by different governmental agencies results in the following findings.
Figure 10
PDVSA Risk Guidelines
- The “acceptable” level of individual risk is slowly rising as newer standards are being proposed.
- Most of the individual risk standards have adopted a “grey area” or negotiable risk band between the unacceptable and acceptable range. This band is often used by the governing agency to negotiate a lower, but still practical, level of risk to the public.
- Currently, the 1.0 x 10⁻⁶ chance of fatality/year individual risk level seems to be generally used as an upper limit of acceptable individual risk.
A similar review of the societal risk guidelines results in the following findings.
- All societal/risk indices reflect the public’s aversion to multiple fatalities. This is shown by the continuously and sometimes dramatically decreasing frequencies (f) associated with higher fatalities (N).
- Most of the societal risk indices define a negotiable risk band between the unacceptable and acceptable boundaries. This band serves two purposes:
- it allows for some uncertainty in the overall analysis,
- it allows the regulating body some freedom in negotiating an “acceptable” risk level for an individual project.
In summary, various risk measurement techniques are now available for use when evaluating petrochemical projects. Although there is no consensus on which standard should be viewed as the best, the standards that are being developed are starting to exhibit two trends.
- The use of a grey or negotiable area between the lower limit of an unacceptable risk and the upper limit of acceptable risk.
- The level of public risk that is defined as acceptable is slowly rising.
Universally accepted risk criteria may never exist since it is clear that the acceptability criteria adopted for use by one community may be inappropriate for use by another community. What is acceptable in Houston, or London, or Singapore might not be acceptable in Caracas, and vice versa. In the end, the question “How safe is safe enough?” must be answered by local authorities using the values of their local communities.
References
- County of Santa Barbara (1991), System Safety and Reliability Review Committee Administrative Guidelines. County of Santa Barbara Resource Management Department Notice, July 25, 1991.
- Health and Safety Executive (1987), The Tolerability of Risk from Nuclear Power Stations. Health and Safety Executive, United Kingdom, 1987.
- PDVSA (1995), Criterios para el Analisis Cuantitativo de Riesgos. Petróleos de Venezuela, S. A., No. IR-S-02, 1995.
- Starr, C. (1969), “Social Benefit Versus Technological Risk.” Science, Vol. 165, September, 1969: pp. 1232-1238.