By
Timothy A. Melton and David W. Johnson
Presented At 1998 Plant Safety Symposium Houston, Texas
October 26-27, 199
Abstract
Although spills of low volatility toxic liquids do not receive the public attention given to releases of high volatility or flammable liquids, releases of low volatility toxic chemicals may present a hazard to facility personnel and the public. The purpose of this paper is to develop a method of ranking and evaluating the hazard presented to the public by a low volatility toxic chemical or a low volatility mixture of toxic chemicals. The ranking system, named LOVRS (LOw Volatility hazards Ranking System), can be used to determine if currently stored chemicals present a hazard to the public, or to screen the list of chemicals that might be stored at a proposed facility. For example, this type of information could be used to determine whether a mixture of chemicals stored at a toxic waste incineration site presents a hazard to the public.
LOVRS employs readily available chemical properties, such as vapor pressure, molecular weight, Short Term Exposure Limit (STEL), Time Weighted Average (TWA), or other selected measure of toxicity, to compute a numerical value that is related to the hazard potential of each chemical. Commonly available sources of the required chemical properties are the CCPS DIPPR data base, NIOSH, etc.
This paper presents ten toxic chemicals which were ranked using LOVRS and compares the results with other ranking methods. Extension of the pure-component ranking equations to multi-component mixtures of hazardous chemicals is developed.
Evaporation rate and dispersion calculations were made for the ten chemicals ranked using LOVRS. The results of the calculations for worst-case conditions (Pasquill F stability, 1.5 m/s wind speed) with an assumed distance of 16,500 ft (5,030 m) to an area of concern are presented. Using the computed results, a relationship is shown to exist between the LOVRS Toxic Index value and the maximum mole fraction of a component that can be present in the released mixture. This relationship can be used to determine the maximum mole fraction at which a toxic chemical can be stored in a low volatility mixture without presenting a hazard to the public.
Text
Introduction

LOVRS The determination of the possible risk of toxic chemical storage facilities to the public often involves many hazard zone calculations for the various chemicals and chemical mixtures that may be present in a facility. When new chemicals are added to the inventory, calculations of the extent of any hazards must be performed for those new chemicals and for any subsequent mixtures of the new chemicals with existing chemicals. Even with a constant number of toxic chemicals present, the large number of possible combinations quickly makes the task of quantifying the risk that the mixtures pose to the public quite daunting. In this paper, we seek to develop a method to allow the quantification of the hazards that chemicals or chemical mixtures with low volatility pose to the public with as few calculations as necessary. To do this, we first develop a ranking system that takes into consideration both the toxicity of the chemical as well as its ability to place its vapor into the air. This ranking is called the Toxic Index (TI). Next, we develop a method for determining whether a chemical, when stored as a pure substance, can generate concentrations over the toxic endpoints at the nearest public receptor to the facility. Finally, the LOVRS parameter is developed which allows chemicals to be screened for their ability to generate hazardous conditions at the public receptor whether stored as a pure substance or in a mixture.
Development of a Toxic Index For Chemicals
A method of ranking hazardous (toxic) chemicals, termed the Toxic Index (TI), will be developed. The purpose of the TI is to rank a list of chemicals with respect to their potential hazard to the public. The ranking methodology employs readily available information, such as the Short Term Exposure Limit (STEL), the Threshold Limit Value (TLV), the vapor pressure of each chemical at 65°F (291.5 K), and molecular weight. The Toxic Index is computed by dividing the estimated vapor concentration at the liquid interface by the STEL (or any other suitable value). Both the vapor concentration and the STEL are expressed in concentration units of milligrams per cubic meter (mg/m3).

STEL values for compounds with only TLVs available are estimated using the equation STEL = 3TLV. This is based on FEMA guidance.)
The interface concentration, Ci, is computed by assuming the vapor above the liquid obeys the ideal gas equation of state. This assumption yields:

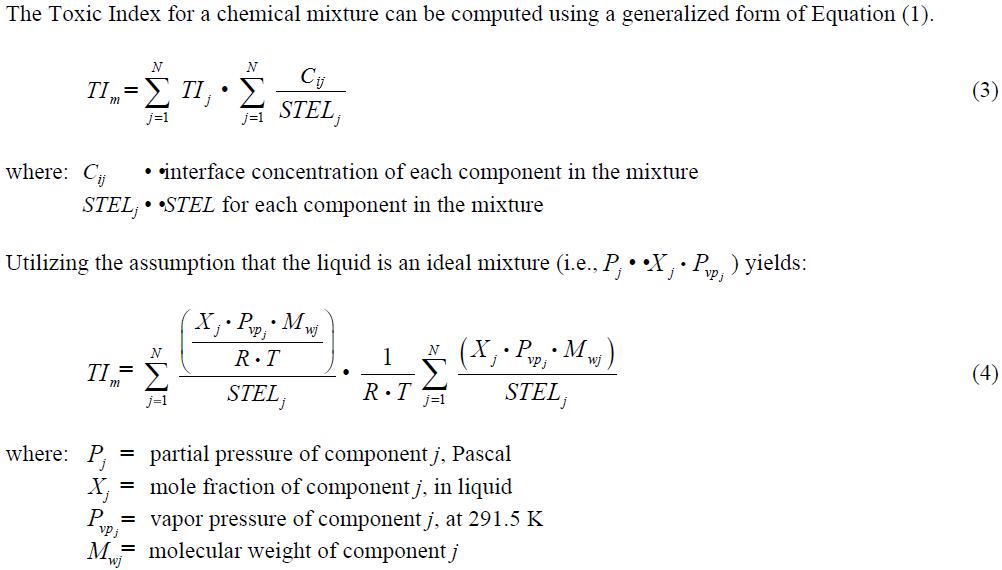
Given the assumptions under which Equation (4) was developed, the mixture Toxic Index will be directly comparable with the pure component index.
The Toxic Index is dimensionless and represents the ratio of the potential of the chemical to evaporate from the liquid pool (i.e., to enter the air stream) and the toxicity of each compound as measured by the STEL. The index uses readily available chemical properties and does not involve complex calculations.
Ranking of Chemicals
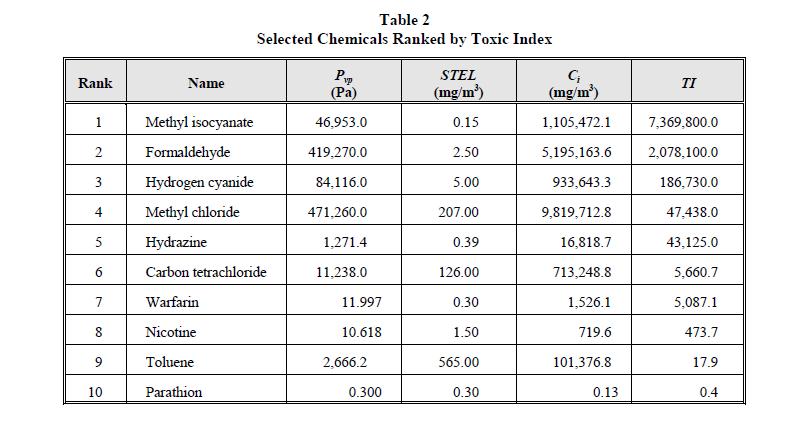
For this study, ten chemicals were selected that had varying degrees of volatility and toxicity. All ten chemicals listed here are listed in 40 CFR 261, Appendix VIII. These chemicals are ranked in order of descending toxicity and vapor pressure, the two simplest methods of ranking, in Table 1. When these chemicals are ranked according to their TI, however, to reflect both the toxicity of the compound and its ability to leave the pool and enter the toxic vapor cloud, their order changes dramatically, as illustrated in Table 2.
Calculation of Evaluation Rates
In order to compute the dispersion distances resulting from a chemical spill, the rate of evaporation of the chemical must be determined. The evaporation rate from a liquid pool is a function of several variables.
- Composition of the liquid
- Temperature of the liquid
- Ambient atmospheric conditions
- Area of the liquid surface
- Depth of the liquid
- Diffusivity of the vapor
- Temperature of the ground
Table 1
Selected Chemicals Ranked by Toxicity and Vapor Pressure
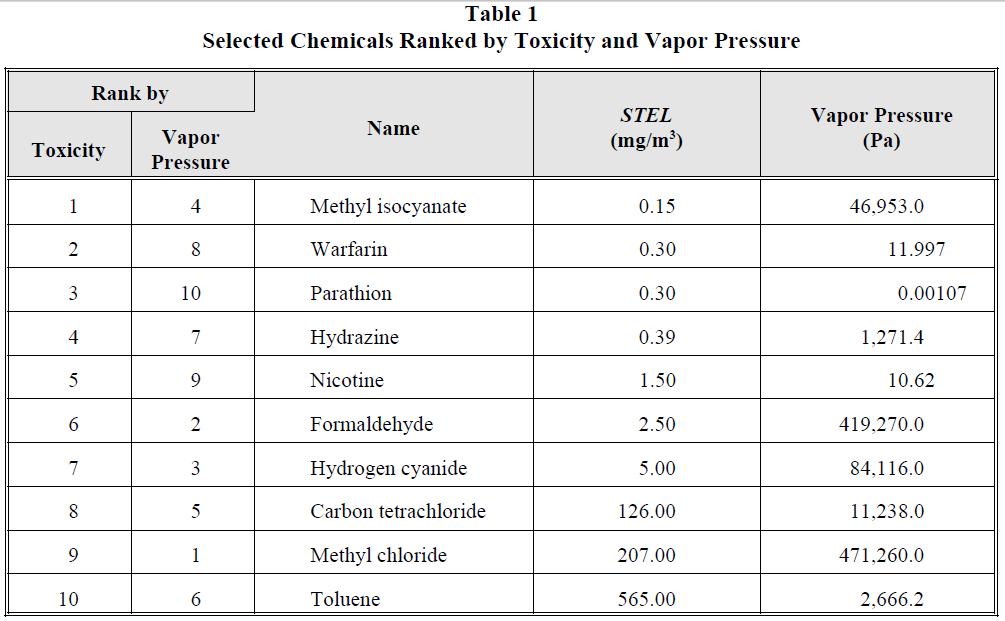
Table 2
Selected Chemicals Ranked by Toxic Index
The modeling of the evaporation rate can be a complex process involving the simultaneous solution of heat and material balances. Additional complications arise if the liquid is not uniform in temperature and composition.
For demonstration purposes, a simple, yet conservative, approach was taken to develop a method of computing evaporation rates from a liquid pool. The pool was assumed to be uniform in composition over the pool volume. Cooling of the pool due to evaporation was also ignored, leaving the pool temperature constant and equal to the surrounding temperature. These assumptions increase the evaporation rate, yielding a conservative estimate.
The basic mass transfer algorithm used in our calculations was presented by Stiver and Mackay [1983a].


All of the terms in Equation (8) are readily available given the atmospheric parameters and liquid composition.
Vapor Dispersion Calculations
To illustrate how the Toxic Index reflects the relative potential for a chemical to impact the public, vapor dispersion calculations were performed for the ten chemicals that are examined in this paper. The chemicals were assumed to have been released into a 10 m by 10 m containment in rural surroundings. A population center was assumed to be located about 16,500 ft (5,030 m) from the facility. It was also assumed that local air quality standards do not allow the facility to release vapors that could result in concentrations above the STEL at the population center for atmospheric conditions of 1.5 m/s wind speed and Pasquill F atmospheric stability. Vapor dispersion calculations were performed for these weather conditions using an area source Gaussian dispersion model. A point source Gaussian model could also be used for the dispersion calculations, but the dispersion results might not give the same vapor concentration at short downwind distances. At distances further removed from the vapor source, both the point source and area source would be expected to give vapor concentrations in good agreement. The centerline concentration versus downwind distance for either the area or point source model is a function of the following variables.

The dispersion coefficients σy and σz were calculated using equations by Briggs [1973]. The results of these calculations are shown in Table 3 and Figure 1. As can be seen from the figure, the log of the Toxic Index is proportional to the log of the distance to the STEL. As Figure 1 shows, any chemical having a TI less than 28,900 would meet the air quality guidelines and could be stored as a pure component at the site. The maximum value of the TI that a pure component can have is given the name of Low Volatility Hazard Ranking System (LOVRS) index.
If a new chemical were to be introduced at the site, its TI could be computed and compared to the value of 28,900. If the TI were below 28,900, the chemical could be stored at the site and the air quality guidelines would be met. Toxic Indices could be calculated for a large number of chemicals using a simple spreadsheet and the results used to quickly determine if a new chemical could be stored at the facility as a pure component.
Mixtures of Chemicals
At many facilities, particularly waste handling facilities, chemicals are stored as mixtures. The question arises, how can the operator determine the maximum concentration levels that each chemical may be stored and still meet air quality guidelines? Can the concept of the Toxic Index be used to determine the highest concentration that a chemical may be safely stored in a mixture? The answer is YES.
Due to the form of the liquid evaporation and vapor dispersion equations developed previously, when the maximum concentration that a material can be stored in a mixture is graphed versus the Toxic Index, the data describe the following relationship between the variables.
Table 3
Results of Dispersion Calculations for Selected Chemicals
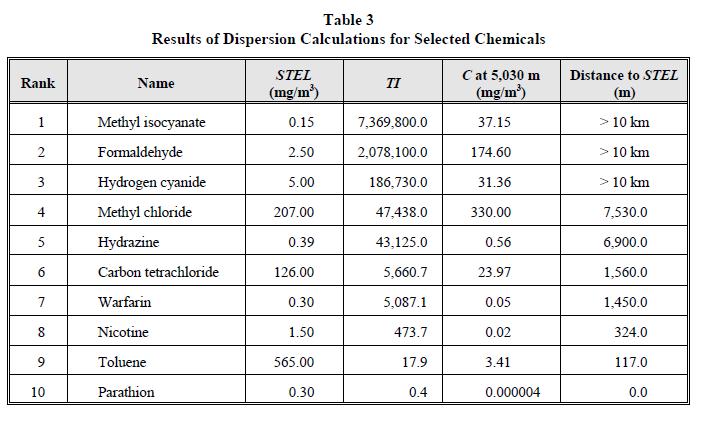
Figure 1
TI versus Distance to STEL


The value of LOVRS is specific to each facility and governing air quality standards. However, at any given facility, one value for LOVRS can be found that will greatly simplify determining the maximum mixture concentration that any chemical can be stored at the facility.
An example can be developed using the ten chemicals described in Table 1. For our hypothetical facility located 5,030 m from a population center and using the local air quality guidelines that require no vapor concentrations above the STEL under 1.5 m/s wind speed and Pasquill F atmospheric conditions, we can plot xmax versus TI -1 to determine the value of LOVRS. Table 4 shows the TI and values computed for these chemicals, and Figure 2 shows a plot of these data for the ten chemicals selected for use in this study.
Table 4
TI and Computed xmax
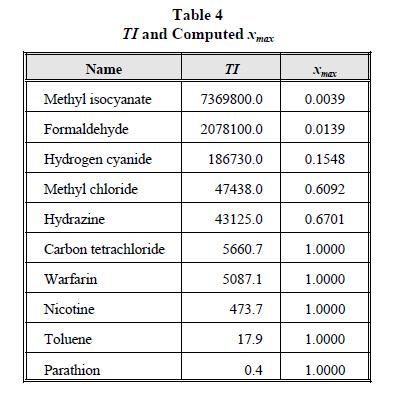
As Figure 2 illustrates, the graph of these data is indeed linear. A linear regression on the data yields a slope of 28,900, resulting in the relationship:

The LOVRS value of 28,900 is identical to the maximum value of the Toxic Index allowable for storing a pure component. When the computed value of xmax is greater than 1.0, the chemical can be stored pure; when the value is less than 1.0, xmax represents the highest mole fraction at which the chemical can be stored.
Figure 2
Toxic Index versus x max

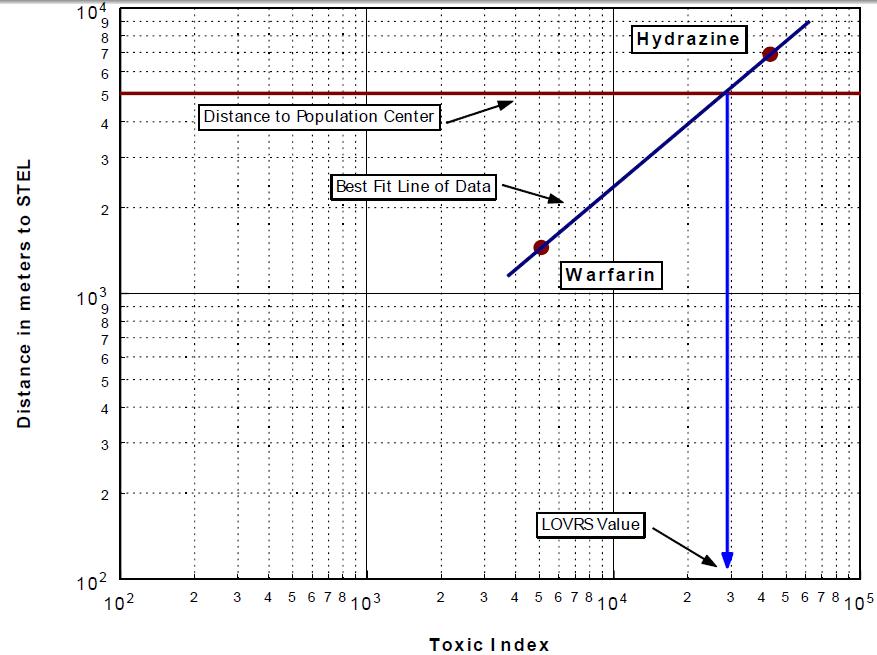
Using an area source Gaussian dispersion model, local air quality guidelines, and the Stiver and Mackay evaporation algorithm, the value of LOVRS can be found utilizing only two chemicals. This is done by plotting the Toxic Index versus the downwind distance to the air quality guideline concentration. A vertical line representing the distance from the facility to the nearest population center will intersect the line defined by the two chemical points at the LOVRS value. Figure 3 shows this methodology using the chemicals hydrazine and warfarin.
The LOVRS value found is applicable for use in computing maximum allowable concentrations for other chemicals that may be stored at the facility.
Conclusions
A method for using readily available material properties, combined with local air quality guidelines, to determine the maximum allowable storage concentration of a wide range of low volatility chemicals has been developed. This method requires the use of only two chemicals to determine the value of the LOw Volatility Ranking System index. The value of LOVRS thus determined can be used to screen other chemicals to determine the highest concentration that they can be stored at the facility.
This technique is simple to use and uses readily available models and chemical properties. It is suitable for use by both facility operators and regulators.
Figure 3
Calculation of LOVRS Index
References
- Briggs, G. A. (1973), “Diffusion Estimation for Small Emissions.” ATDL Rep. No. 79, ATDL, Post Office Box E, Oak Ridge, Tennessee 37830, 1973.
- Stiver, W., and D. Mackay (1983a), “Evaporation Rates of Chemical Spills.” Proceedings of the Technical Seminar on Chemical Spills, Environment Canada First Technical Spills Seminar, Toronto, Canada, 1983.
- Stiver, W., and D. Mackay (1983b), “A Spill Hazard Ranking System for Chemicals.” Proceedings of the Technical Seminar on Chemical Spills, Environment Canada First Technical Spills Seminar, Toronto, Canada, 1983.